
Records show that my family have been in the United States for a long time with my most recent arrivals coming to the country over 150 years ago. And, they were in Canada prior to migrating southward. As such, most of them migrated to the United States or the Colonies before immigration records were well kept.
Thus, finding the location where ancestors lived prior their arrival in North America can be challenging. Occasionally, a census, naturalization record, or other record will have a piece of information. However, the earlier they immigrated, the less likely their origin will be found in records.
The Data
Fortunately, DNA helps provide clues to the locations where distant ancestors lived. I chose to look at Dad’s DNA for clues to my paternal line in part because he has data from four different companies. (The things dads do for their daughters.)
I have results from Dad’s autosomal DNA testing from Ancestry, 23andme, and MyHeritage. In addition, he did a Y-DNA test with FTDNA. Each of these companies provide different views of data and their analysis varies. The particular data they have collected to date and other factors influence their definition of ethnicity regions and how they categorize results.
It is important to understand that the the technology behind the ethnicity information is emerging. Therefore, results evolve and change over time. However, they appear to be more consistent and more detailed today than a few years ago. Still, changes will happen in the future.
Ethnicity Results
Each autosomal DNA testing company has their own set of data regarding regions associated with a person’s DNA. These regions often overlap and are often defined differently based on the algorithms and data set of each company.
The table below shows the percentage DNA based on each company. Where possible, regions with one company that may be associated with a region of another company are shown on the same line. 23andme and Ancestry, group specific regions into a general region. Those are shown alongside the related specific regions.
For example, with 23andme, English, Scottish, and Welsh are part of British & Irish. Meanwhile East Midlands, NE England, and SE England & NW Europe are part of the group England on Ancestry. On Ancestry, Central Scotland & N Ireland are part of a separate Celtic & Gaelic group. The next section provides maps so that regions can be compared.
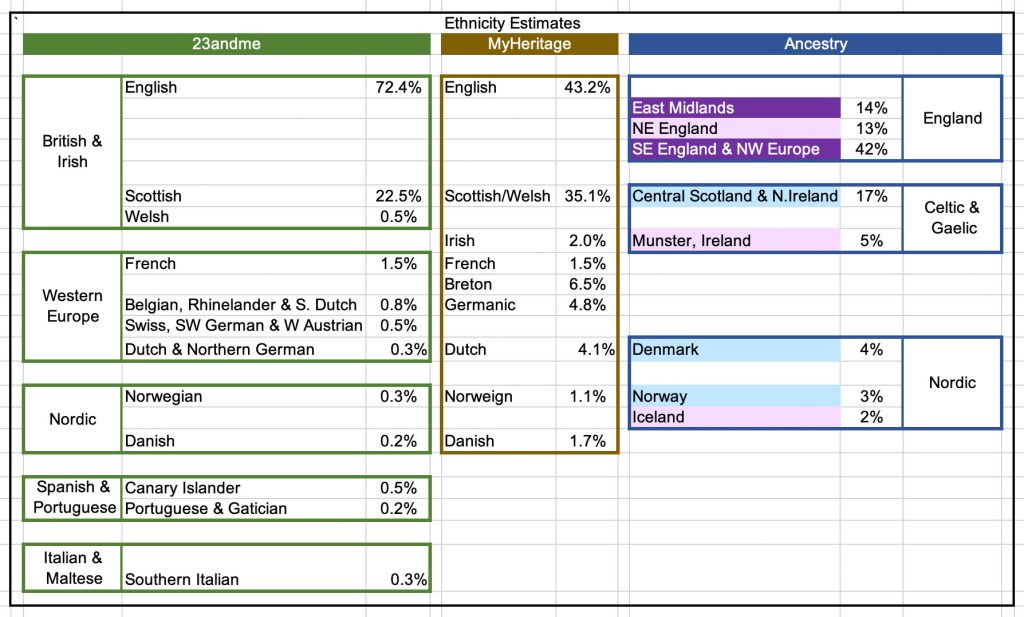
The initial take-aways from these charts are that many of the regions, although different, are represented in each company’s analysis of Dad’s DNA. Still, there are deltas. For instance, only 23andme includes Southern Italian. However, it is a very tiny percentage of Dad’s ethnicity makeup.
The pink, blue, and purple coloring in the Ancestry data refers to whether that region is associated with his paternal line (blue), maternal line (pink), or both (purple). Further details are provided in a later section.
Maps of Ethnicity Regions
Each company has their own ethnicity regions based on their data and algorithms. These maps indicate the regions related to Dad’s DNA for each company. Thus, you can see how the various defined region overlap.
Ancestry
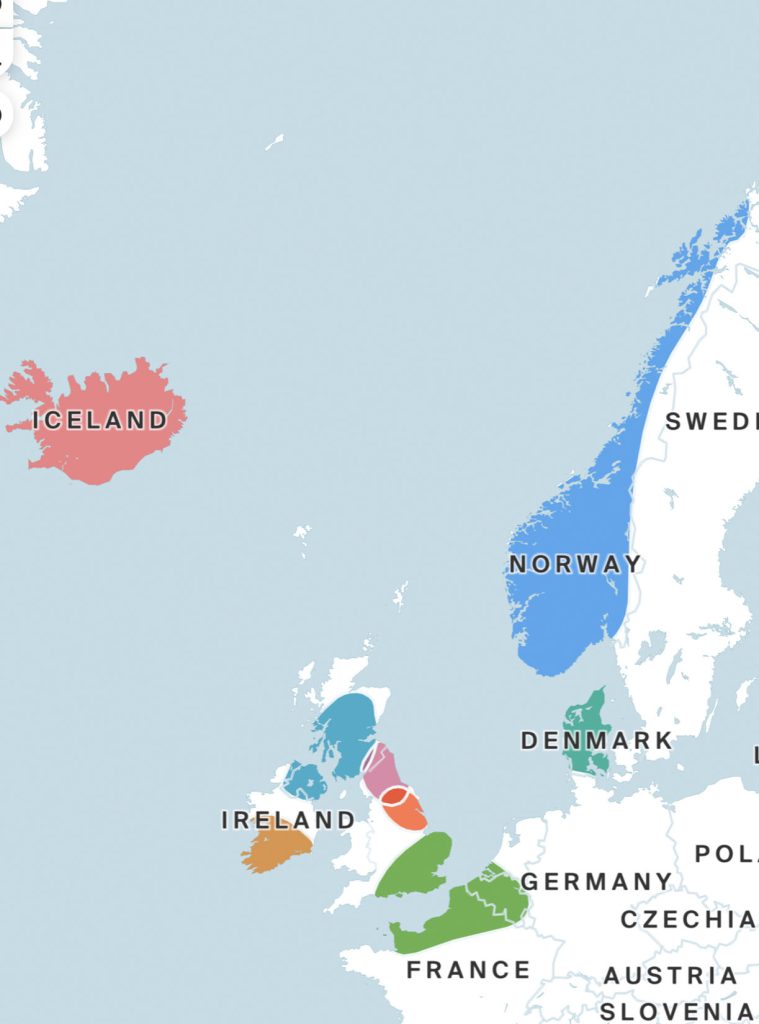
You can see that with Ancestry one of the regions covers a portion of southern England and a small portion of France and Germany.
23andme
The 23andme regions are difficult to see as they use shades of blue for all of the ones pertaining to Dad’s DNA. However, you can clearly see that they define all of England as a region and they separate France and Germany from England.
MyHeritage
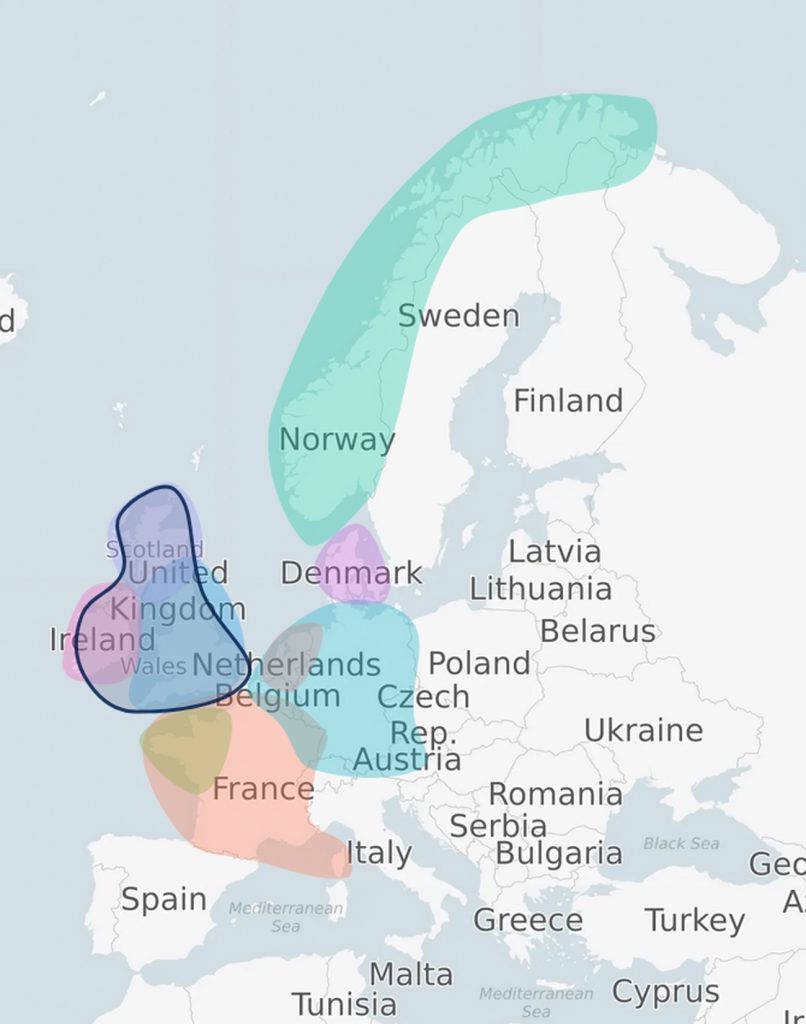
My heritage also splits England, France, and Germany. Note: The dark overlay over the UK is a genetic group. These will be discussed in the next article.
Observations
Overall, it is clear that Dad’s heritage is from a relatively small area of the world. He doesn’t appear to have any stray DNA from the Middle East, Africa, or Asia. 23andme has some unique entries, but they are very small percentages. Small percentage regions tend to come and go. Thus, these may disappear. Only time will tell.
Chromosomes & Regions
Ancestry has the ability to determine which parent of a person is associated with a given region without either parent having ever tested. They do this by associating regions to chromosomes. 23andme also has a Chromosome view, but doesn’t create a “by parent view” unless one parent has tested. Ancestry.com’s parent view is shown below.
Chromosome View
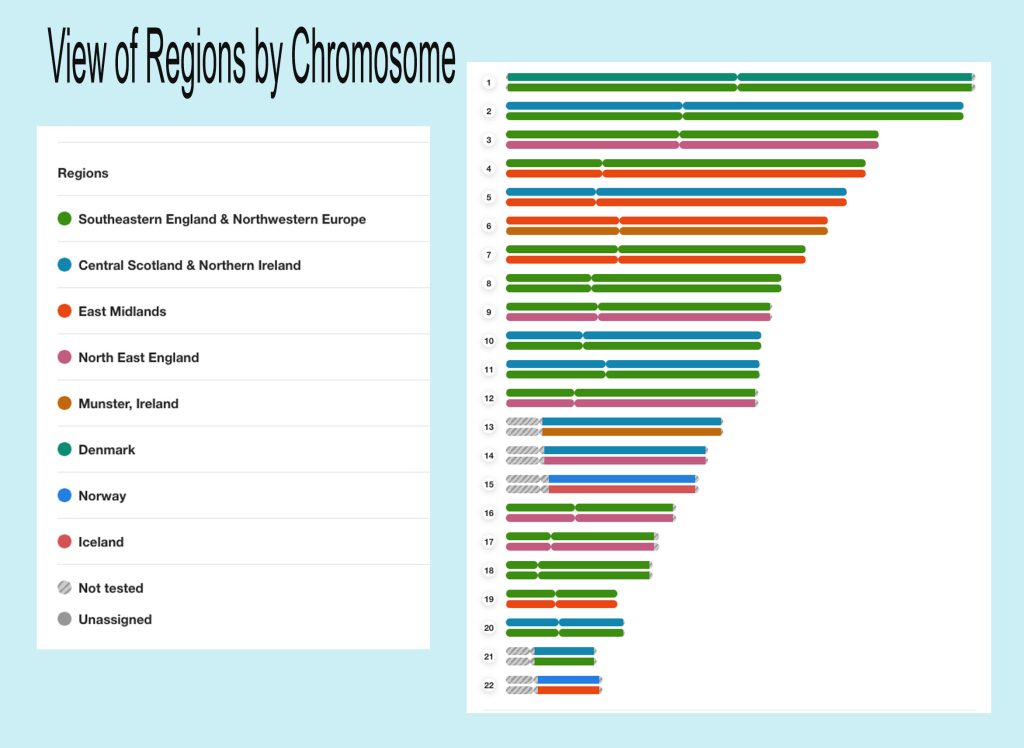
Ancestry Chromosome View
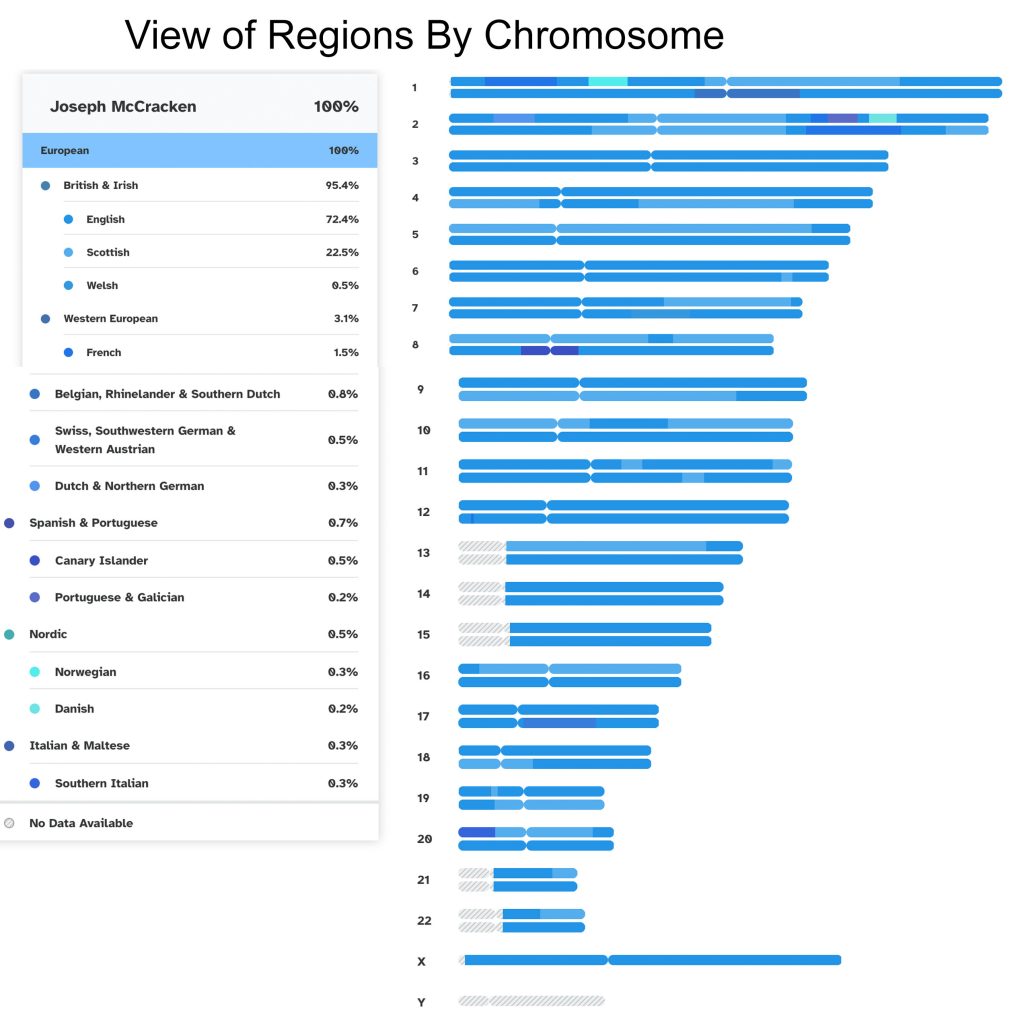
The following chart shows Ancestry.com’s regions associated with each of Dad’s chromosomes. For each chromosome pair, the top chromosome is paternal and the bottom one is maternal. Generally, the longer the segment is, the more recent ancestors from that region contributed to the DNA.
23andme Chromosome View
The following chart shows 23andme.com’s regions associated with each of Dad’s chromosomes. Their color scheme makes seeing specific regions difficult. In addition, they identify many of the regions on “both sides.” For instance, Scottish shows both on the top and bottom chromosomes and in several of the pairs. On the other hand, Ancestry identifies Central Scotland & Northern Ireland exclusively on the paternal side.
Understanding the Data
This doesn’t provide a specific year or even range of years that a parent with a region’s DNA became a part of Dad’s DNA. Matter of fact, in many cases, a region was likely injected at multiple points over the years. Still, it gives an indicator of timing and perhaps percentage of ancestors from a region.
It is important, however, to remember that DNA inherits unevenly. Thus, everything should be considered relative, but not absolute. This includes regions that are missing. Just because a region is not present in a person’s DNA does not mean that they don’t have ancestry in that region.
Additionally, the regions represent pieces of DNA unique to a region. Therefore, a family may have been in that region and then migrated to another region before coming to America. And, direct ancestors from all regions didn’t necessarily come to America.
Observations
One observation is the amount of different chromosomes that are tied to to the regions associated with the U.K. These regions clearly had a strong influence on Dad’ DNA from both a paternal and maternal perspectives.
DNA By Parent
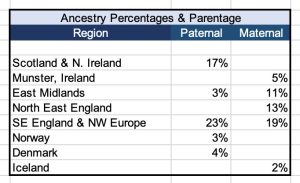
Based on the mapping of regions to chromosomes, Ancestry estimates how much DNA related to a region came from each parent.
The chart shows the percentages of DNA associated with each region for each parent. A blank value indicates that there is none.
Therefore, one would not expect any of his mother’s families to be associated with Scotland or North Ireland. That said, it is always possible that an undetected amount of DNA associated with distant relatives could come from his mother’s side, but most does not.
Timeline
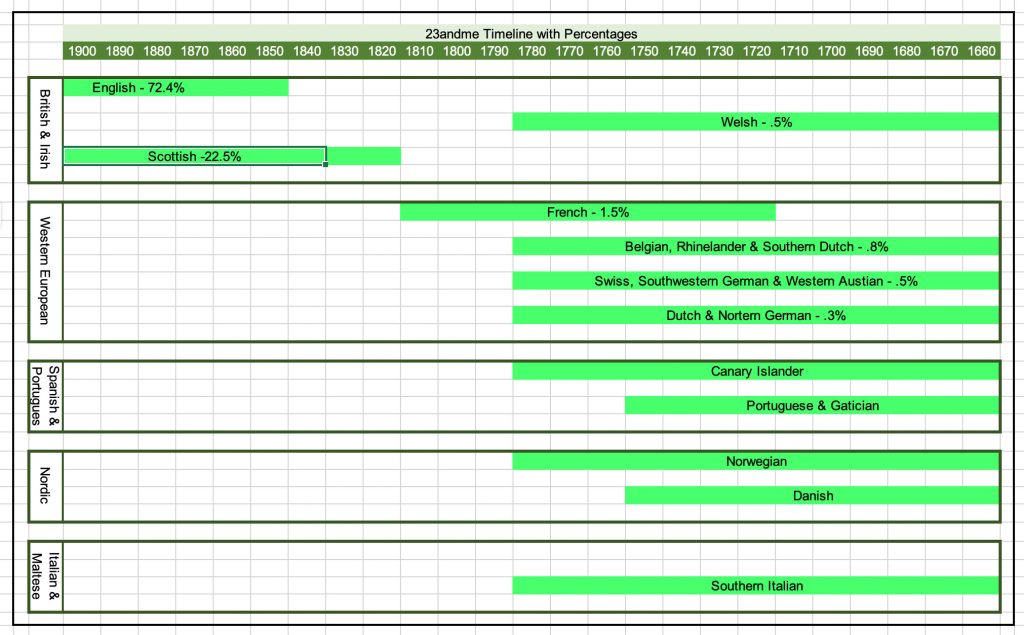
To address the same question of how far back in time a region was introduced into a person’s DNA, 23andme provides an estimated timeline of when an ancestor with a given background may have lived. The estimate is not exact, but gives an idea of the time frame for each region.
To do this, they assume that all of the DNA from a given region came from one person and combine that with the percentage of DNA from that region. Again, this gives a general idea. However, often, and definitely the case for Dad, DNA from a region came from multiple people.
Observations
English, Scottish, and French align with known records. The connection to some of other regions are not only unknown, but were a complete surprise. The connections between families and regions will be discussed in further detail in part 2 of this article.
Number of Matches
MyHeritage provides a different type of data that can also be interesting when looking at where your family originated or lived just prior to moving to America.
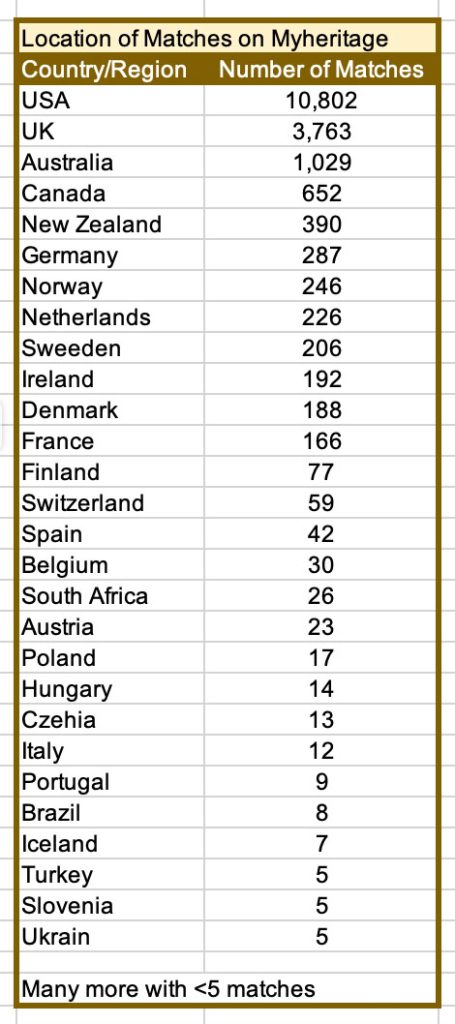
They provide a list of the number of DNA matches a person has who live in a given country or region. This doesn’t mean that your ancestors ever lived in that particular area. However, it can provide some indicator of relationship to a given country
Of course, it is also dependent on where people test and that can be influenced by local laws, which in some countries limit DNA testing or make general genetic testing that isn’t medically necessary illegal.
Observations
In Dad’s data, the most matches by far are in the United States. This is exactly what is expected since he has ancestors that arrived as early as 1621 with the latest arriving in 1869.
The second largest group is the UK, which matches nicely with his high percentage of DNA from the British Isles.
The UK is followed by Australia. This isn’t unusual since the UK sent many people to Australia and others immigrated on their own.
The next is Canada where a portion of his family lived before coming to the United States. My great-great-grandfather John D. Jury’s sister remained in Canada as did other more distant relatives.
Germany can be explained at least in part by the Sturm/Storms family. The Matteer family may also be a contributor to the number of people in Germany although they may also be in France.
After this it gets a bit murkier. Exactly how these regions fit with Dad’s families will require more work.
Putting It all Together
The origin of some of Dad’s ancestor families is known – at least generally, but specifics remain unknown. Part 2 of this article will use all these pieces of data, along with information on surnames (See previous article) and information on genetic groups/ancestral journeys to guesstimate where the various families originated. So, stay tuned. . . .
Featured Image: geralt via pixabay.com
Prompt: Possibilities
#52ancestors52weeks